")
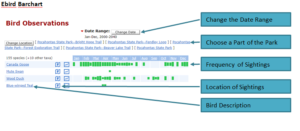
eBird is a Web site that is used by birders world-wide to record their sightings of birds by species, location, and time. By 2017, more than 360,000 eBirders had submitted 472 million bird sightings, representing 10,364 species across every country in the world. eBird consolidates this information to provide summaries of bird sightings across the entire eBird data base. For our purposes, we will use the eBird bar chart for birding hotspots (or known birding locations). These birding hotspots correspond to the parks in our collection. A sample bar chart is shown in the first screen shot below.
The first thing to notice about the bar chart is that it has separate bars for every week of every month, and a separate row for each species. The height of the bar indicates the frequency of sightings for one species in one week, calculated as a percentage of the checklists for that week that contained that species. If the bar is blank, the species was not seen that week. In the sample chart, for example, the mute swan was seen in only one week of the year, on roughly half of the checklists. If a species has never been seen in this area within the specified time frame, that species will not appear on the list. If the bar shows a thick area of gray shading, this indicates that no checklists have been submitted for the week in question.
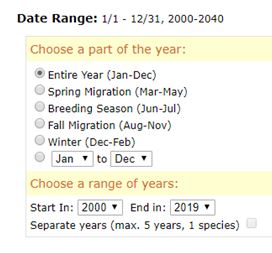
The bar chart calculates frequencies across years, as shown in the date range. Note that we are using the upper date range of 2040 solely to force the bar chart to automatically use the current date each time you open it. As shown in the second screen shot below, you can change the date range to fit your needs. This can be especially useful if you are planning to visit a park at a specific time of the year. If you change the month to May, for example, only the species seen in that month will appear on list.
For larger parks, there may be multiple hotspots within the park. In the sample chart for Pocahontas State Park, there are 5 hotspots shown. Four of them are well-known birding areas or trails within the park, and one represents the whole park. We combine these results. If you are interested in only one specific hotspot (e.g., the Beaver Dam Trail), select it from the list and only its results will appear. If you choose the Location of Sightings icon for a specific species, eBird will show sightings on a map. If you select the species name from the list, eBird will provide you with a detailed description of the bird.
Using these capabilities, you can prepare yourself for a visit to a park by familiarizing yourself with the birds you may be likely to see. This tool is best used on a desktop computer or tablet, since it can be hard to read on a smaller mobile device. To better understand eBird’s other features, go here.
eBird Date Ranges